
Week 7
Open Data Week
This past week was Open Data Week in New York, a week-long collection of events intended to encourage use and awareness of datasets that are readily available to the public. I originally intended to attend both the Data Through Design art installation and the Talk Data to Me panel, but the latter was cancelled due to weather and was postponed until early April. I will attend that event then and document my experience in the corresponding blog post.
Data Through Design
Data Through Design was an art installation consisting of a collection of various pieces created by artists and cs people across various artistic mediums. The work in the exhibtion was meant used to show the interesting conclusions that can be drawn from the public datasets and present them in interesting and novel ways.
I thought that generally the exhibition was a really cool idea. I think people generally don’t find data or its implications very interesting, and the different works did a nice job of showing how this data can come together to present interesting and enlightening stories. My one critique would be that the exhibit was much smaller than I anticipated, and I ran through all the pieces in about fifteen minutes. Obviously that’s not a very legitimate basis for criticism, but if they have the same event next year I’d it to receive more attention/resources from the organizers. Also, the event seemed to be held in some sort of communal office space, which was a little distracting.
One of the pieces that appealed to me most was a three-dimensional graphic depicting Manhattan and the statistical breakdown of the different varieties of trees that grow in different neighborhoods on the island. It was really interesting to look at my own neighborhood and see the different species that are around and compare with other parts of the city. There was also a piece that had a grid of LED lights, each dot representing a day of the year. The LED’s lit up as a clock cycled to show if a sexual crime had taken place during that time. It was a very powerful way of drawing attention to a very pressing issue and articulating the scope of a problem in an accessible way.
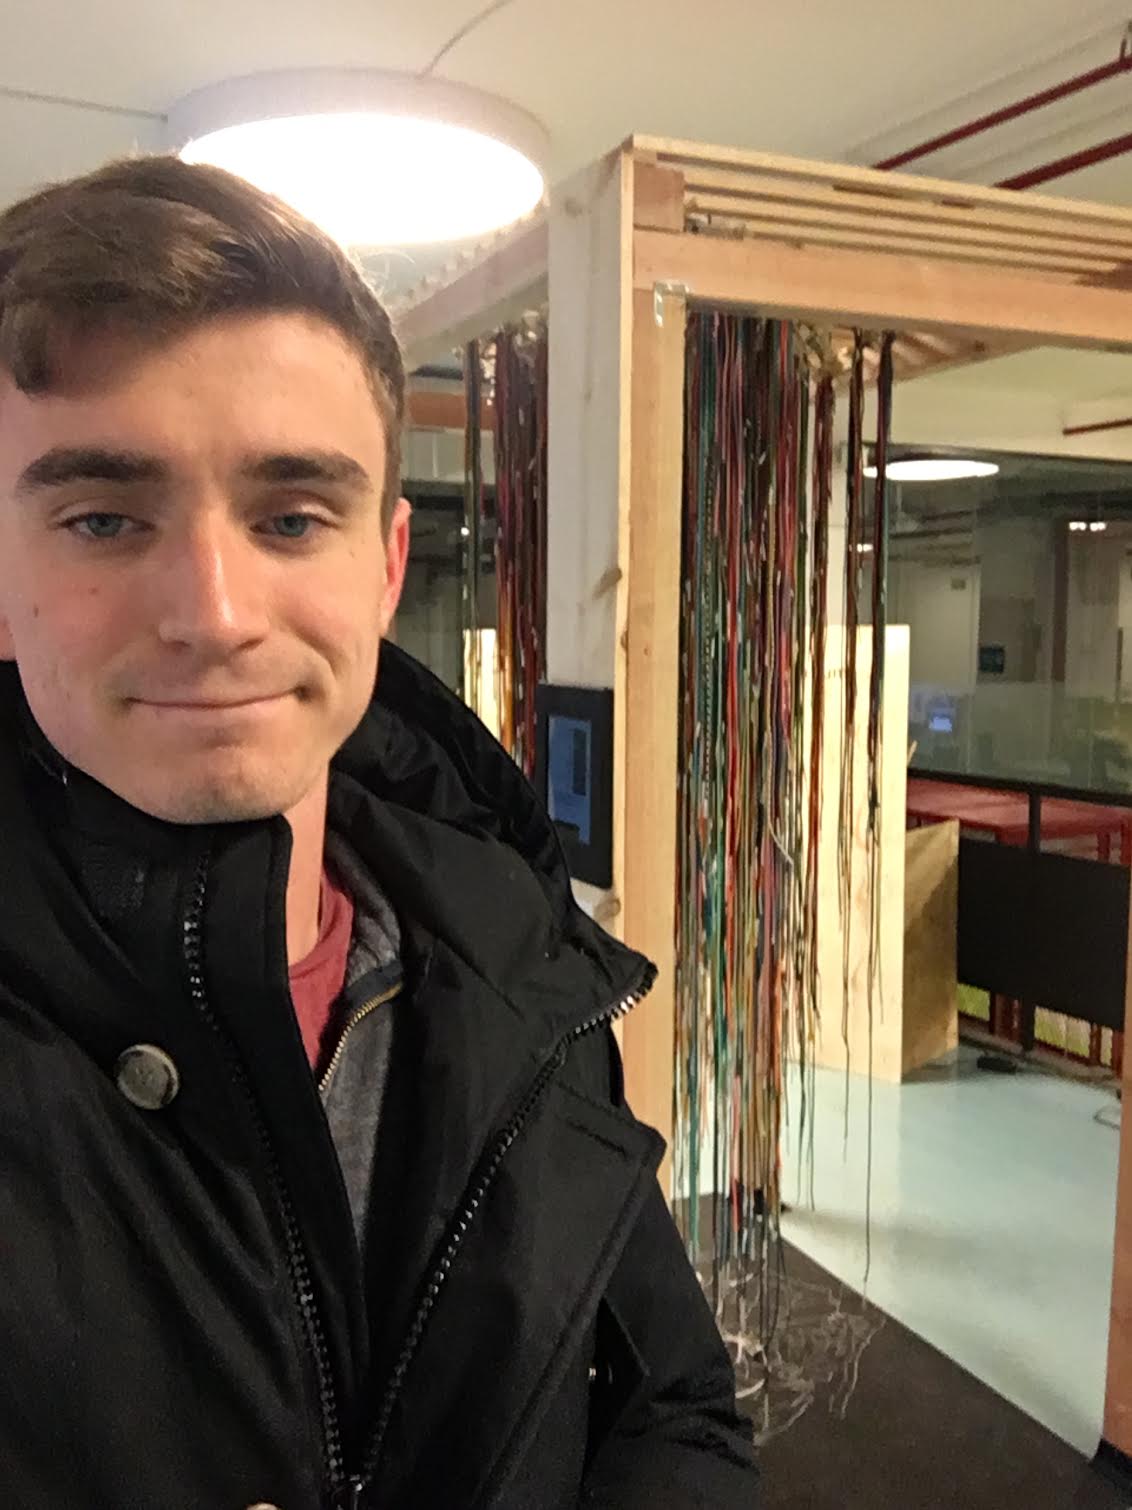
This poorly taken selfie is of me standing in front of a piece that visualized the amount of criminal citations of different kinds across geographic space in the city. The different kinds of cord represent the different types of crimes.
Talk Data To Me
Unfortunately this event was postponed until April 5th. I was really looking forward to it, and none of the other free events coincided well with my schedule, so I will attend the make-up panel next month and blog about it then.